
Liquidity Sweep vs. Breakout: ICT Lesson 2
Price moves above an old high. Does it return below, hold above, or break out and then fail? Learn to read the close and the candles that follow.

The same high can lead to different outcomes
Price has just traded above an old high. Is that a liquidity sweep, or the start of a breakout? At the first touch, the chart may not give you enough information to choose. Both examples begin with the same move through the same level.
This lesson compares what happens afterward: a return below the high, a move that holds above it, and a breakout that later fails. The six charts use the same starting structure, with different candles added after price reaches the high. They are constructed examples, so their completed outcomes are visible. In real time, those later candles have not formed yet.
The useful habit is to describe what price has done so far, then update that description as new candles close.
The starting high is identical. The candles that follow create two different readings.
1. Mark the old high before price reaches it
Start with an identifiable high and keep that reference fixed. In Lesson 1: BSL and SSL, we introduced BSL, or Buy-Side Liquidity: an area above old highs where buy stops may be triggered. Those orders can come from traders closing short positions or entering upside breakouts.
A candle chart shows traded prices. It does not reveal how many stop orders exist above the high or why individual traders placed them. The BSL label is a way to frame a potential order area, rather than a count of visible orders.
Previous highs and lows are also common reference points in support and resistance analysis. CME Group explains these levels and how their role can change after a break. Here, we keep one old high marked so the comparison stays consistent.
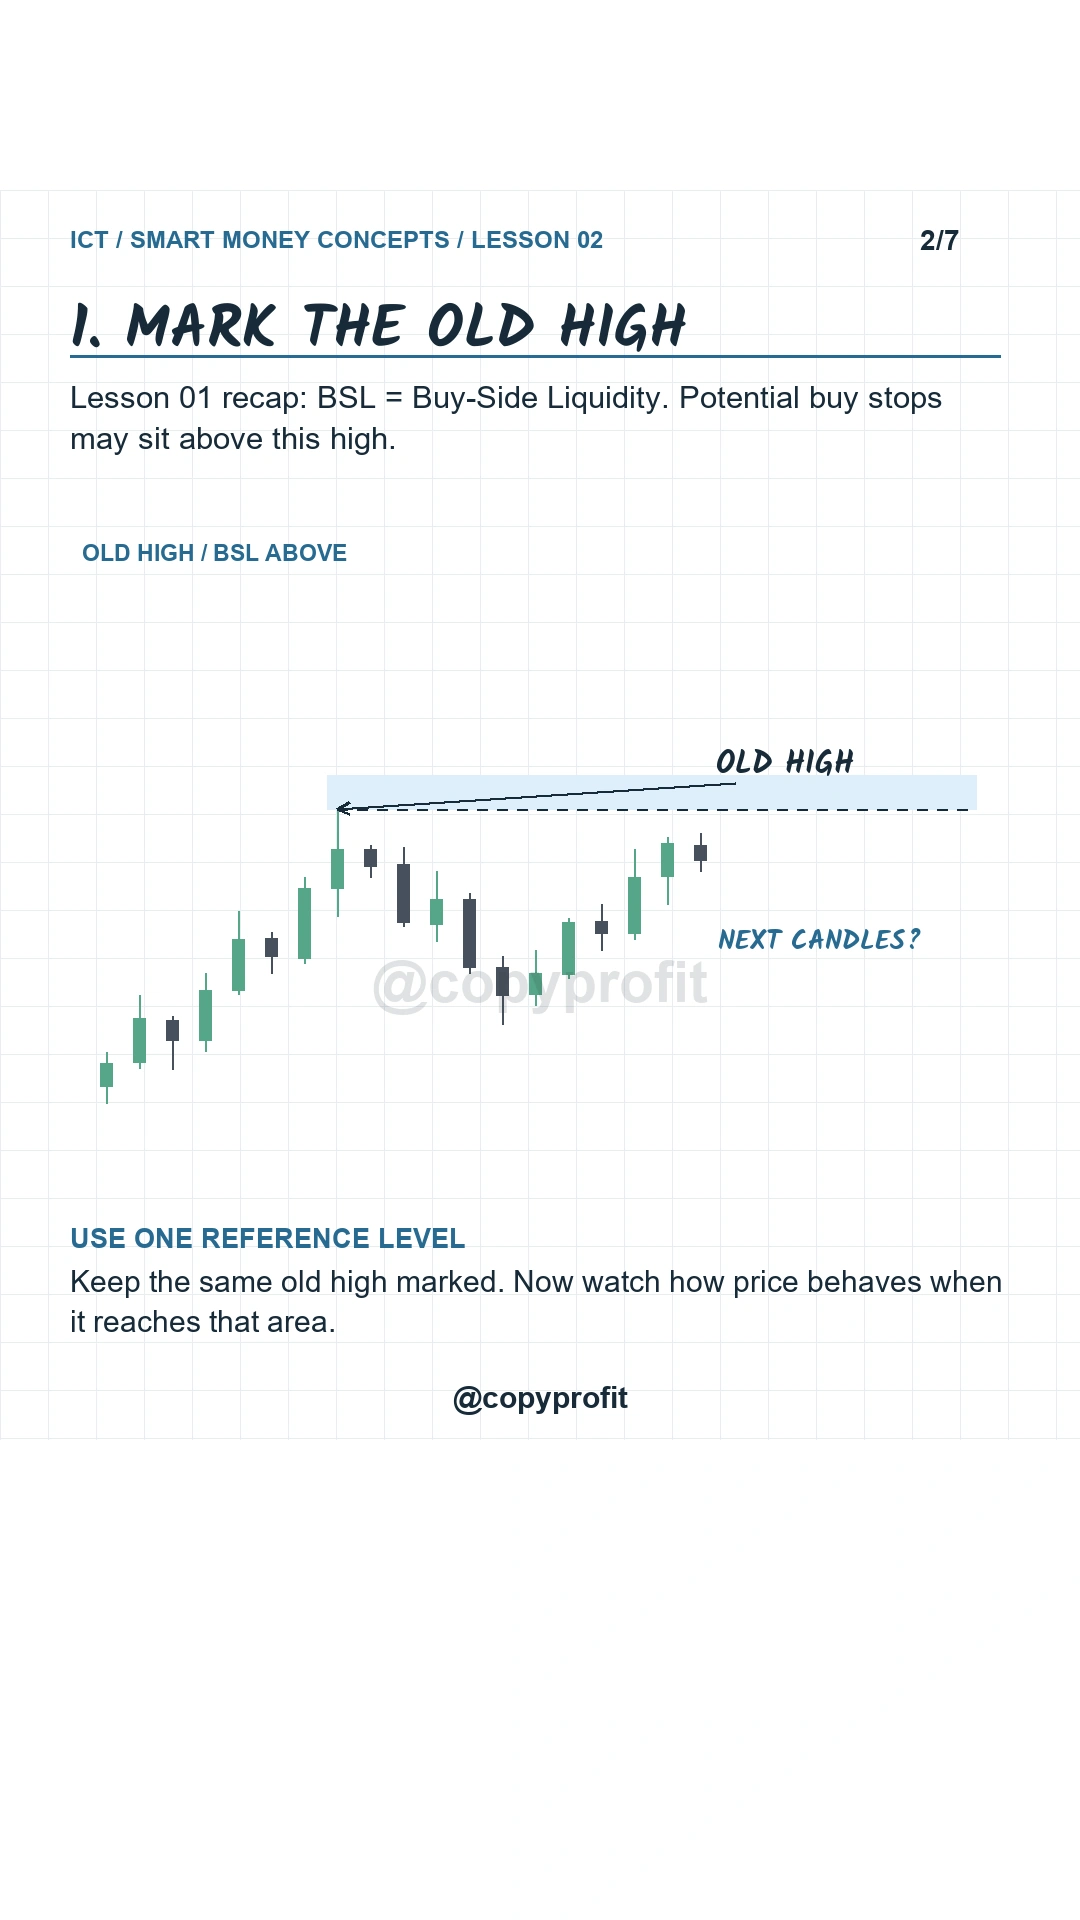
Mark the reference high first. Keep it in place as the next candles develop.
2. Read the sweep example: above, then back below
In this example, a candle trades above the marked high but closes back below it. Its upper wick shows that price reached beyond the level. Its close shows that the candle finished on the other side.
The next candles then move lower. Together, the move above, return below, and downward follow-through create the rejection sequence shown in the chart. This is the sweep example used throughout the lesson.
Keep the sequence separate from a prediction. A wick above a high does not guarantee a reversal, and a sweep does not always fit into one candle. Price can move through a level, return across it over several candles, and later change direction again. These charts teach how to describe the observed behavior; they do not establish an entry signal by themselves.
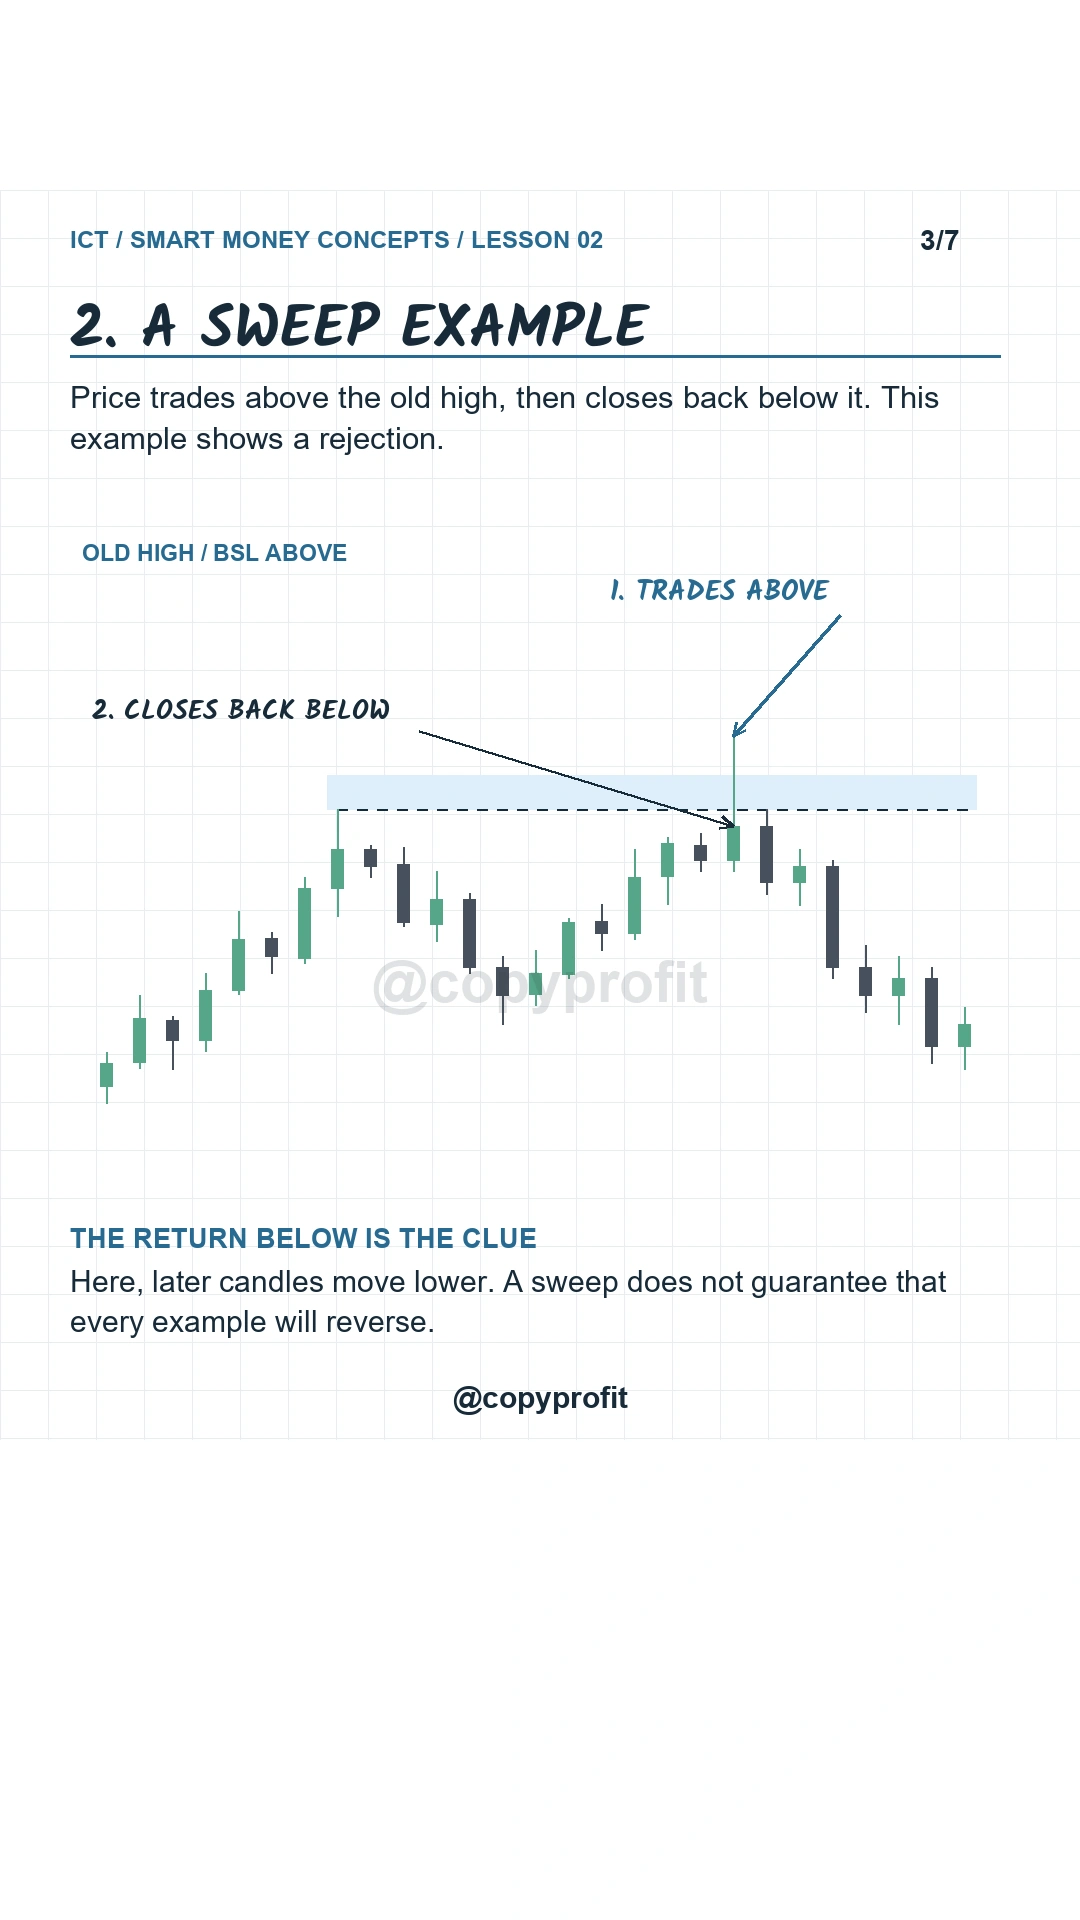
The return below is the first clue. Later candles provide the follow-through shown here.
3. Read the breakout example: above, then holding
The breakout example begins with a candle closing above the old high. Later candles remain above the reference area. A pullback reaches near the level, then price moves higher again.
That sequence supports a breakout reading in this completed example: a close above, a pullback that holds, and upward follow-through. The old high gives you a consistent place to judge where those candles are forming.
A retest is part of this drawing, but it is not required in every breakout. Some moves continue without returning to the level. Others stall, cross back below, or fail before a clean pullback appears. A first close above tells you where one candle finished. It does not tell you where the next candle will finish.
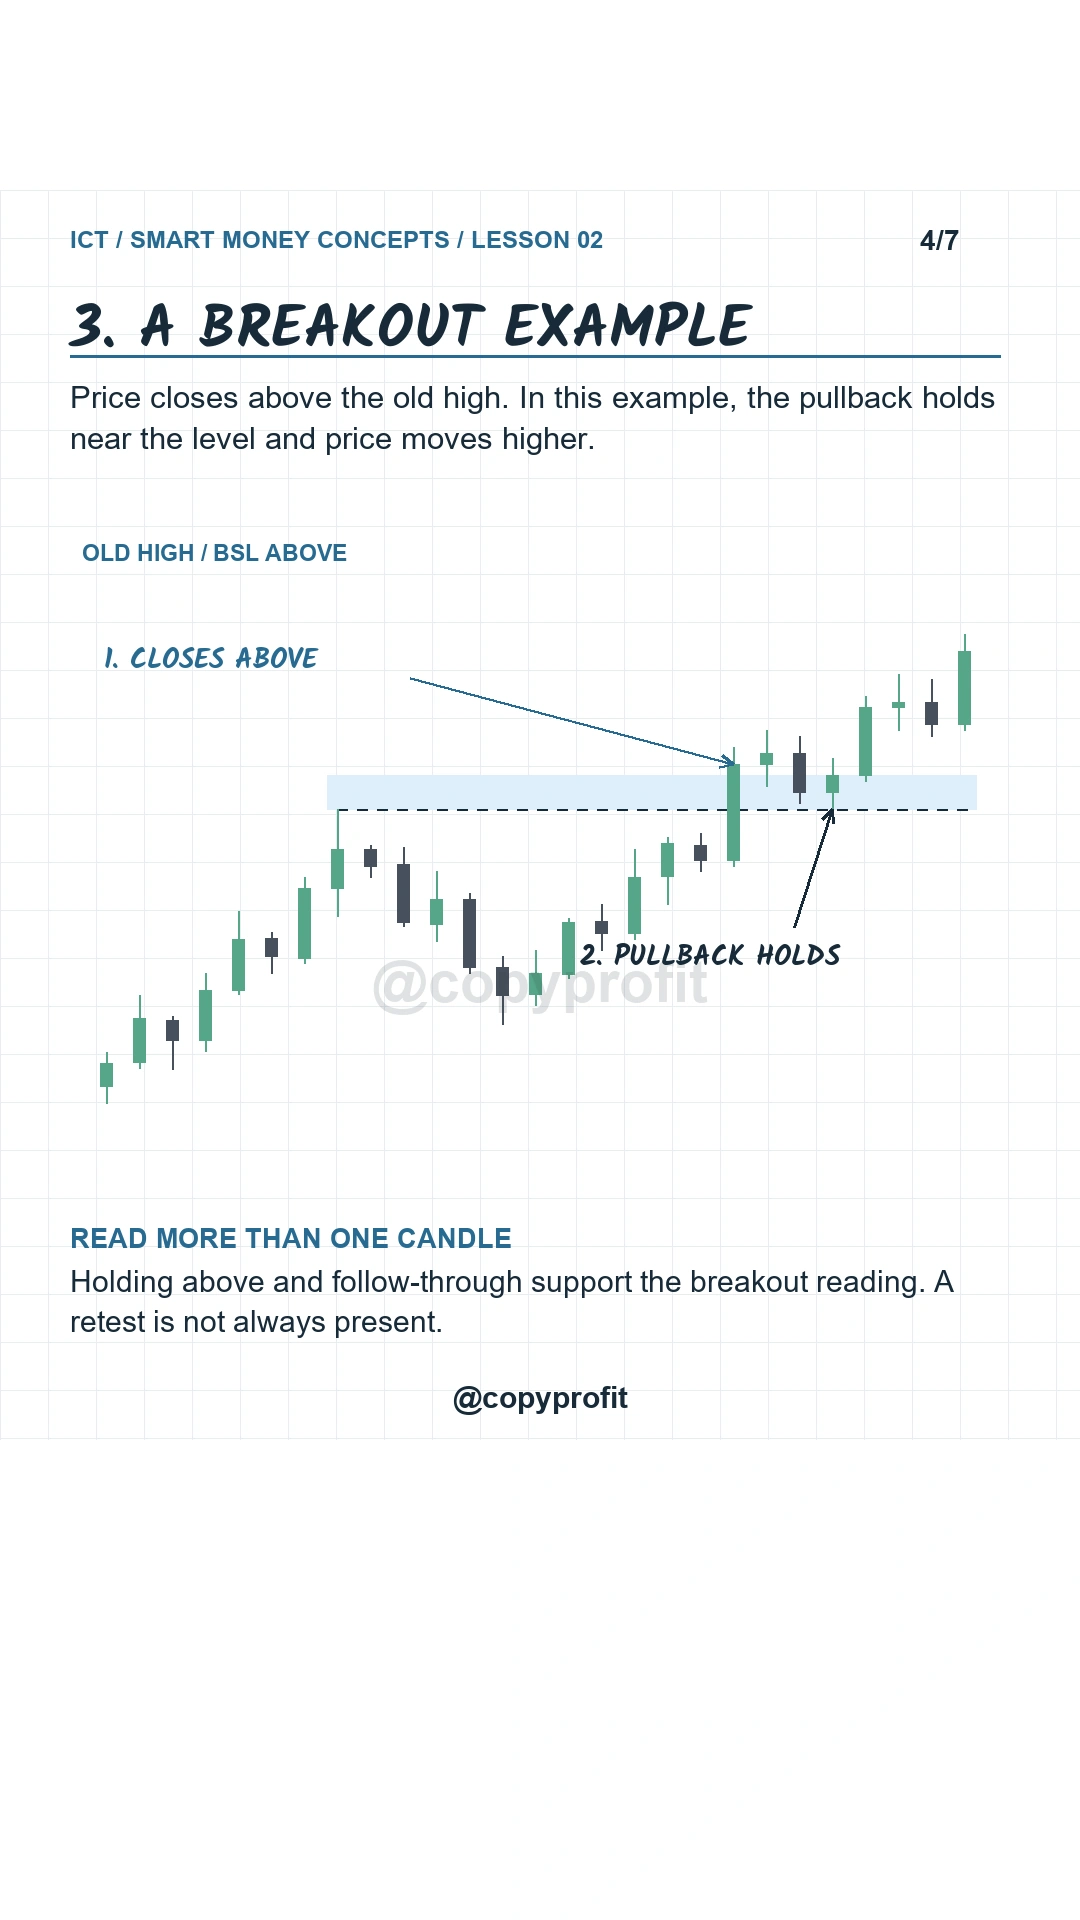
This example holds above the old high and continues. Other breakouts can develop differently.
4. Compare location, close, and follow-through
Use the same timeframe when comparing the examples. A close means the end of the candle interval you selected: a five-minute close and a daily close describe different periods. Switching intervals halfway through the comparison can obscure what you are measuring.
- Location: Where is price relative to the original high?
- Close: Did the completed candle finish above or below it?
- Follow-through: What did the next candles actually do?
In the left chart, price returns below and continues lower. In the right chart, it holds above and continues higher. During a live move, you may only have the first part of either sequence. An unfinished candle can still change before the interval ends, and a completed candle remains just one piece of the developing structure.
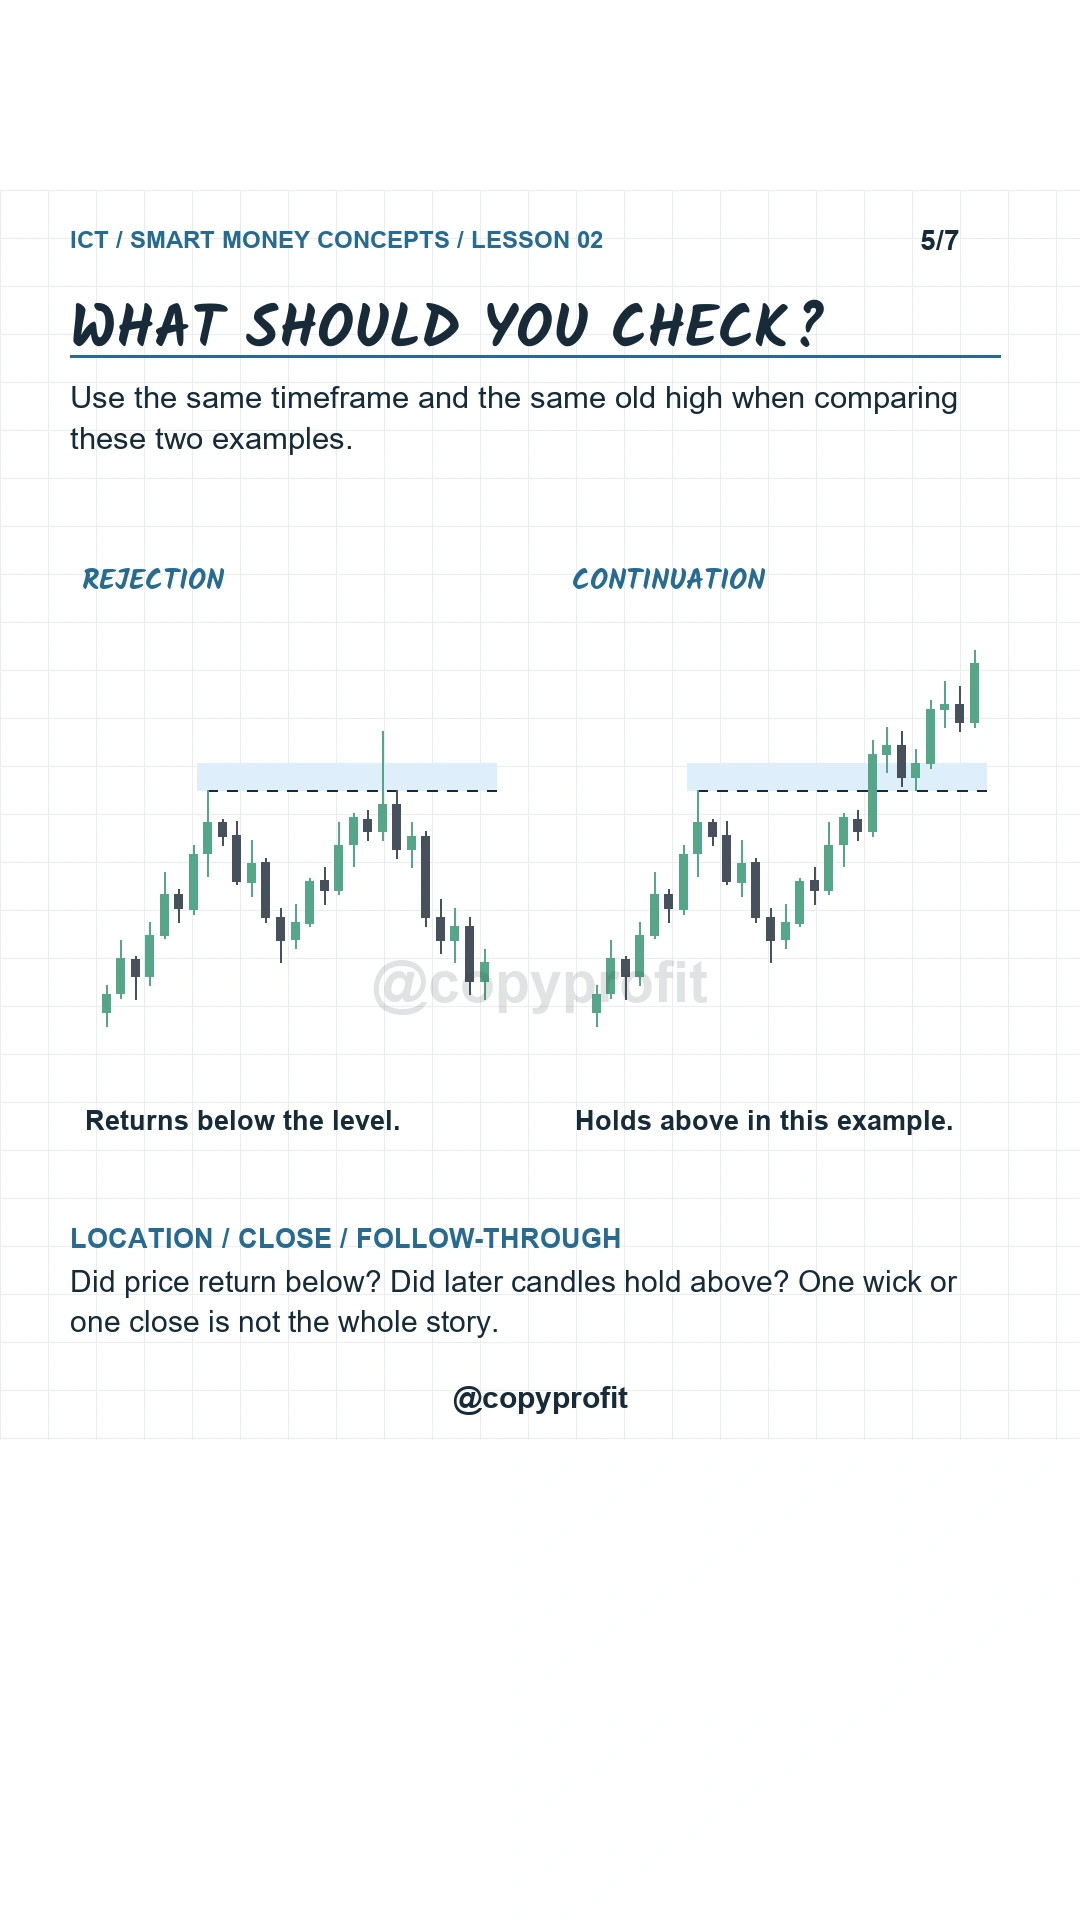
Compare the same level on the same timeframe. Read the sequence, not just one wick.
5. A close above can still fail
The final chart first looks like a breakout: price closes above the old high. Two candles later, it closes back below. Further candles move lower. The initial close was real, but the move did not hold.
This is why the lesson includes a third outcome. Labeling every close above as a successful breakout hides the possibility of failure. Labeling every move above as a reversal makes the opposite mistake. New candles can change the reading.
For chart practice, pause before the outcome is visible. Mark the old high, describe the current close, and reveal the next candle. Repeat without moving the reference level. The same exercise works below an old low, where SSL means Sell-Side Liquidity. Lesson 3 will examine displacement and the strength of the move away from a level.
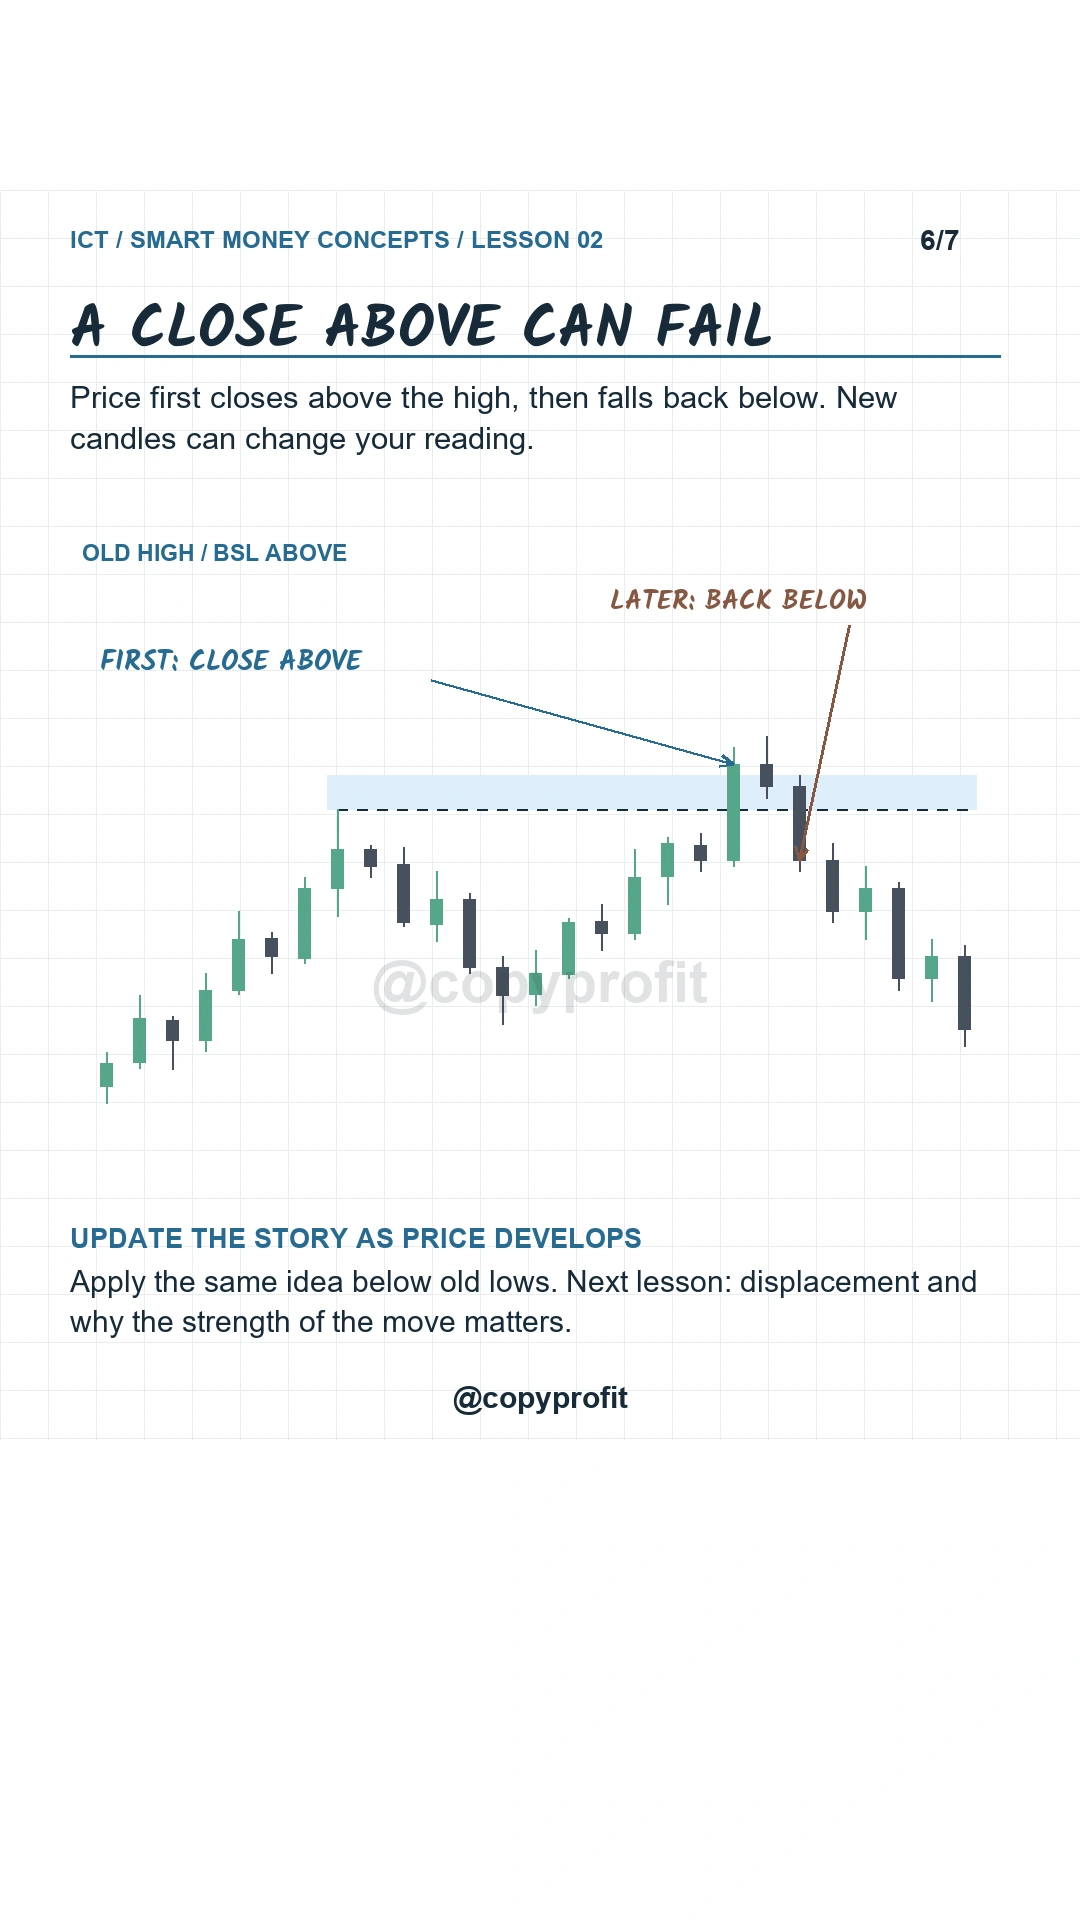
The first close above does not settle the outcome. Update your reading as later candles form.